Factory Digitalization Ver08. “Pareto Chart × Defect Reduction”— Maximizing Improvement Impact Through Focus and Prioritization
- Shigenori Tanaka

- 4月7日
- 読了時間: 2分
更新日:5月27日
Apr 07, 2026
Hello everyone,
Today, I would like to discuss a topic that is both fundamental and often misunderstood in manufacturing sites: Pareto Charts and defect reduction.
Many factories say, “We want to reduce defect rates” or “We want AI to identify defect causes,” but in reality, improvement does not progress if the data is used incorrectly.
🟦 1. Visualize “Production Volume × Defect Rate” by Product
The first step is to compile, for each product:
Production volume
Defect rate
into a spreadsheet.
By doing this, you can calculate the “defective volume” for each product as:
Defective Volume = Production Volume × Defect Rate

Next, expand the spreadsheet on the upper right into the following Pareto Chart:

This allows you to immediately identify the products that:
Have high production volume, and
Also have a high defect rate
—in other words, the products that cause the greatest loss to the company.
The essence of a Pareto Chart is to identify where you should focus your improvement efforts.
🟦 2. Deep dive into the top products and classify defect types
Next, take the top-loss products and break down the defect types.
Here, it is essential to classify defects into two categories.
Type A: Defects that can be improved by adjusting the production process
Examples:
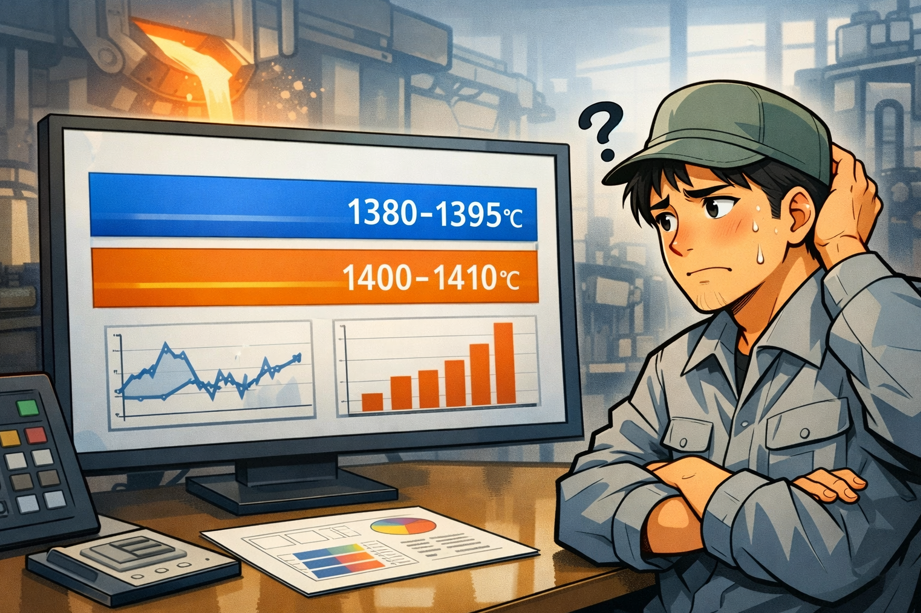
Condition settings (temperature, pressure, speed, etc.)
Equipment condition
Work procedures
Time-of-day or shift differences
** This is where AI delivers the greatest impact.
Type B: Defects caused by mold design or product design
Examples:
Pattern design
Gate location
Core design
Product geometry constraints
** AI cannot improve these. Design modification is required.
🟦 3. AI is effective only for “Type A” defects
AI can only improve process-driven defects (Type A).
However, this is where the real value lies.
If Type A defects are reduced by 40%
The company gains significant cost improvement, including:
Scrap reduction
Rework labor reduction
Material cost reduction
Increased production capacity
Improved on-time delivery
AI investment can be fully justified.
🟦 4. Trying to “fix all defects” is inefficient
A common mistake in many factories is:
“Let's address all high-defect items.”
This spreads resources thin and dilutes improvement impact.
On the other hand:
Focusing on products where improvement yields the greatest effect provides the best ROI (Return on Investment) for AI investment.
This is exactly the principle of focus and prioritization.
🟦 5. Conclusion: A Pareto Chart is the “starting point,” not the “final answer”
A Pareto Chart is the starting point for defect reduction.
It helps determine:
Which products to focus on
Which defects are improvable
Where AI should be applied
It is a decision-making tool, not the final solution.
To maximize improvement impact:
Prioritize by production volume × defect rate
Classify defects into Type A and Type B
Apply AI to Type A defects
Collaborate with design teams for Type B defects
Ultimately, the purpose of AI implementation is profit improvement.
🟦 Contact
For consultation on manufacturing digitalization, quality data utilization, or AI-driven defect reduction, feel free to contact: info@metricjapan.com
🟦 TAGS


コメント